 Ashar Pervaiz
Healthy Body Fat Percentage by Age and Gender: The Complete Reference Guide
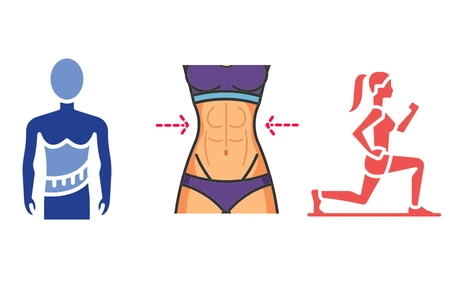
You step on the scale and the number stares back at you. But here is what that number cannot tell you: how much of your body is fat versus muscle, bone, and water. Two people can weigh exactly the same and have completely different health profiles. Body fat percentage is the metric that actually tells you what your body is made of — and what your real health risk looks like. This guide gives you the exact ranges, the age-specific charts, and the honest context you need to interpret your own number.
What Is a Healthy Body Fat Percentage?
According to the American Council on Exercise (ACE) and NIH/WHO Gallagher guidelines, a healthy body fat percentage for women generally falls between 21–35% depending on age, and between 8–25% for men depending on age. These ranges rise naturally with age because muscle mass declines 3–8% per decade after age 30 (sarcopenia), shifting body composition even when total weight stays the same. A 22% reading means something very different at age 25 than at age 55.
Why Body Fat Percentage Beats Weight and BMI Every Time
Picture two people. Both are 5 feet 10 inches tall and weigh 185 pounds. The scale treats them identically. BMI treats them identically. But one is a competitive swimmer with 12% body fat and 163 pounds of lean muscle. The other has 28% body fat, a soft midsection, and early signs of insulin resistance. Same number. Completely different bodies. Completely different health trajectories.
This is the fundamental problem with weight and BMI as health metrics. They measure mass, not composition. They cannot distinguish a pound of fat from a pound of muscle. And that distinction matters enormously for your metabolic health, your disease risk, and how you actually feel day to day.
Body fat percentage fixes this. It measures the proportion of your total body weight that is fat tissue, and it does so regardless of your height or frame size. A 2025 study published in the Annals of Family Medicine found that body fat percentage was a stronger predictor of 15-year mortality risk in adults aged 20–49 than BMI — a finding that reinforces what sports medicine and endocrinology have known for decades.
The American Medical Association formally acknowledged BMI's limitations in 2023, recommending complementary measures including body fat percentage and waist circumference as more accurate indicators of cardiometabolic risk. We are well past the point of using BMI as the sole measure of body composition health.
That said, body fat percentage is still a single number. It doesn't capture where your fat is stored, which matters a great deal. More on that in the visceral fat section below.
The Five Body Fat Categories Explained (ACE Framework)
The most widely cited classification system in fitness and medicine comes from the American Council on Exercise. It divides body fat into five named categories that describe both physiological function and health risk. These are the numbers you'll see on most clinical reference charts.
| Category | Women | Men | What It Means |
|---|---|---|---|
| Essential Fat | 10–13% | 2–5% | Minimum fat for organ function, hormonal health, and survival. Not a sustainable target for most people. |
| Athlete | 14–20% | 6–13% | Maintained by competitive athletes. Optimal performance and leanness balance. Below ~17% for women can disrupt menstrual function. |
| Fitness | 21–24% | 14–17% | ACE's recommended healthy target. Lean, energetic, low disease risk. Sustainable with regular training. |
| Acceptable | 25–31% | 18–25% | Healthy for the general population. Normal metabolic function. Some disease risk begins rising at the upper end. |
| Obese | 32%+ | 26%+ | Elevated risk of cardiovascular disease, type 2 diabetes, and metabolic syndrome. Particularly concerning if fat is visceral. |
One important note: the ACE categories do not adjust for age. They represent population-wide benchmarks, primarily calibrated for adults in their 20s and 30s. As you move into your 40s, 50s, and 60s, the acceptable and healthy ranges shift upward — which is why the age-specific charts in the next section matter so much.
Body Fat Percentage Chart for Men by Age
The following ranges are drawn from the NIH/WHO Gallagher et al. guidelines — one of the most rigorous age-stratified body fat classification systems available, based on large population data. The "normal" column represents the healthy, low-disease-risk range for men at each life stage.
| Age Group | Too Low | Healthy / Normal | High | Obese |
|---|---|---|---|---|
| 20–39 | Below 8% | 8–19.9% | 20–24.9% | 25%+ |
| 40–59 | Below 11% | 11–21.9% | 22–27.9% | 28%+ |
| 60–79 | Below 13% | 13–24.9% | 25–29.9% | 30%+ |
Source: Gallagher et al., NIH/WHO guidelines. Published in the Journal of Public Health in Africa.
Notice how the healthy range shifts upward with each decade. A 45-year-old man at 20% body fat is squarely in the healthy zone. A 25-year-old man at 20% is approaching the "high" category. This is not a flaw in the data — it reflects the biological reality of aging. Muscle mass declines naturally from your 30s onward, and some increase in fat percentage is expected and normal.
For practical planning targets by decade based on ACE and BodySpec's analysis of over 450,000 DEXA scans: men in their 20s should generally aim for 10–19%, men in their 30s for 12–20%, men in their 40s for 14–22%, men in their 50s for 16–23%, and men in their 60s and beyond for 17–25%.
Body Fat Percentage Chart for Women by Age
Women naturally carry higher body fat percentages than men at every age and fitness level. This is not a health disparity — it is biology. Women require roughly two to three times more essential fat than men to support estrogen production, reproductive function, and the physiological demands of pregnancy and breastfeeding. The ranges below reflect this.
| Age Group | Too Low | Healthy / Normal | High | Obese |
|---|---|---|---|---|
| 20–39 | Below 21% | 21–32.9% | 33–38.9% | 39%+ |
| 40–59 | Below 23% | 23–33.9% | 34–39.9% | 40%+ |
| 60–79 | Below 24% | 24–35.9% | 36–41.9% | 42%+ |
Source: Gallagher et al., NIH/WHO guidelines. Data cross-referenced with InBody USA and BodySpec DEXA scan population data (2025).
For practical decade-by-decade planning targets for women: 20s aim for 20–24% (fitness range), 30s aim for 21–25%, 40s aim for 24–30%, 50s aim for 26–32%, 60s and beyond aim for 27–35%. Women in the athlete category may run 5–10 percentage points below these values, though extended time below 17% can disrupt menstrual function in premenopausal women and should only be maintained with medical monitoring.
Why Your Healthy Range Changes With Age (The Biology Behind the Numbers)
It is tempting to look at a 25-year-old athlete's body fat percentage and set it as your target at 50. Resist that temptation. The biology of body composition changes meaningfully across the lifespan, and chasing a young person's numbers can actually lead to harmful behaviors — particularly for women past perimenopause. Here is what is actually happening in your body at each stage.
Your 20s: Peak Metabolic Advantage
This is when body composition is at its most malleable. Testosterone and growth hormone are near lifetime peaks in men, making muscle gain efficient and fat loss responsive to even modest caloric deficits. Women in their 20s benefit from estrogen's role in supporting lean mass maintenance and preferentially storing fat subcutaneously (under the skin, around hips and thighs) rather than viscerally (around organs). The muscle you build in your 20s creates a metabolic reserve you carry forward for decades — which is why many experts call the 20s the most important decade for building skeletal muscle.
Your 30s: The Somatopause Begins
Growth hormone levels begin a slow but measurable decline around age 30 — a process sometimes called somatopause. Without active resistance training, muscle mass may start decreasing by roughly 3–5% per decade. The key phrase is "without active resistance training." This is not inevitable, but it does require effort that wasn't previously necessary. Career demands, young children, and more sedentary work patterns converge in the 30s to make consistent training harder — which is exactly when it matters most.
Your 40s: When Accumulated Choices Start Showing
The 40s are when the metabolic cost of the previous decade's habits begins to compound. Resting metabolic rate drops measurably — not because metabolism is "slowing down" as a mysterious phenomenon, but because less muscle mass means fewer calories burned at rest. Testosterone begins declining in men. For women, perimenopause typically begins, and fluctuating estrogen levels start redistributing fat from peripheral stores (hips and thighs) to central stores (abdomen) — a shift that carries higher metabolic risk regardless of total body fat percentage.
A 2025 study found that inactive women lose 3–8% of lean mass per decade starting in their 30s. By their 40s, this creates the "skinny fat" pattern — normal body weight, higher body fat percentage, lower muscle mass — which is measurably more dangerous than the scale suggests.
Your 50s and 60s: Sarcopenia and Hormonal Pivots
Sarcopenia — age-related muscle loss — accelerates in the 50s and 60s in the absence of targeted resistance training. For women, menopause completes the hormonal shift that began in perimenopause. Estrogen loss significantly accelerates both fat gain and bone density loss. For men, testosterone continues declining, increasing visceral fat accumulation even without weight gain.
Harvard Health Publishing notes that in adults 60 and older, the dangerous combination of higher fat mass and lower muscle mass — called sarcopenic obesity — carries greater health risks than obesity alone, because it directly impairs physical functioning, falls resistance, and metabolic resilience. This is why body fat targets for people over 60 are intentionally set higher than for younger adults: some additional fat is acceptable, but preserving muscle is critical.
Visceral Fat: Why Where You Store Fat Matters as Much as How Much You Have
Body fat percentage is not a complete picture on its own. Two people at 22% body fat can have very different health risk profiles depending on where their fat is stored. This is the visceral fat problem, and it is arguably more important than total body fat percentage for long-term health.
Fat is stored in two primary locations. Subcutaneous fat sits under the skin — the fat you can pinch on your arms, hips, and thighs. It is largely inert metabolically, and having more of it is not particularly dangerous. Visceral fat surrounds your internal organs in the abdominal cavity. It is metabolically active, producing inflammatory cytokines and free fatty acids that directly raise the risk of type 2 diabetes, cardiovascular disease, insulin resistance, non-alcoholic fatty liver disease, and certain cancers.
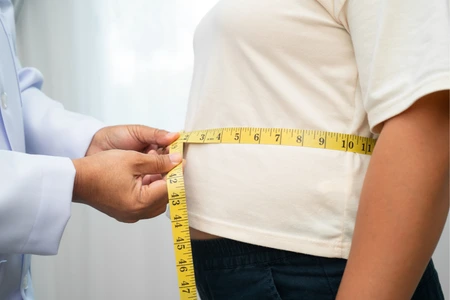
You cannot see visceral fat on a scale or even in a mirror with precision. Someone can appear lean externally while carrying dangerous amounts of visceral fat — particularly men with apple-shaped fat distribution, and post-menopausal women whose fat has shifted centrally. The clinical proxy for visceral fat is waist circumference: risk begins rising above 35 inches (89 cm) for women and 40 inches (102 cm) for men, regardless of total body fat percentage.
For accurate visceral fat measurement, a DEXA scan is the gold standard — more on that in the measurement section below. If a DEXA scan isn't accessible, tracking your waist circumference alongside your body fat percentage gives you a much more complete metabolic health picture than either number alone.
How to Measure Your Body Fat Percentage: From Most to Least Accurate
There is significant variation in the accuracy of different measurement methods. Knowing the error margin of your chosen method is just as important as the number you get. Here is a practical breakdown.
| Method | Accuracy | Cost | Notes |
|---|---|---|---|
| DEXA Scan | ±1–2% | $50–$150 per scan | Gold standard. Measures fat, lean mass, bone density, and visceral fat separately. Requires a facility. |
| Hydrostatic (Underwater) Weighing | ±2–3% | $50–$100 | Very accurate but inconvenient. Submerged in water; fat is less dense and causes buoyancy. |
| Bod Pod (Air Displacement) | ±2–4% | $50–$100 | Similar principle to hydrostatic. More comfortable, slightly less common. |
| InBody / Clinical BIA | ±3–5% | Free–$30 at gyms | Good estimate. Sensitive to hydration. Test consistently: same time, same hydration state. |
| Skinfold Calipers | ±3–4% (skilled) | Under $30 | Accurate when done by a trained technician. Highly technique-dependent. |
| Consumer Smart Scales (BIA) | ±4–8% | $30–$200 | Convenient for trend tracking but not precise enough for clinical decisions. |
| BMI (proxy only) | Poor for individuals | Free | Correlates with population body fat averages but fails badly for muscular or very lean individuals. |
The most important rule with any measurement method: consistency beats accuracy. If you measure on a consumer BIA scale every quarter under identical conditions (same time of day, same hydration state, same hours since eating), the trend line you see is meaningful even if the absolute number is off by a few percentage points. What you are watching for is directional change — is your body fat percentage going up, down, or staying stable?
Body Fat Goals by Decade: A Practical Reference
Rather than chasing a single universal target, here is a decade-by-decade guide to realistic, health-supporting body fat goals for non-athletes. These are drawn from ACE, InBody, BodySpec DEXA population data, and the Gallagher NIH guidelines.
| Decade | Men — Ideal Target | Women — Ideal Target | Primary Focus |
|---|---|---|---|
| 20s | 10–19% | 20–24% | Build muscle aggressively. This is your most responsive decade. |
| 30s | 12–20% | 21–25% | Maintain muscle. Add resistance training if you haven't already. |
| 40s | 14–22% | 24–30% | Prioritize muscle preservation. Metabolic rate begins measurably declining. |
| 50s | 16–23% | 26–32% | Protein intake becomes critical. Aim for 1.6g/kg body weight minimum. |
| 60s+ | 17–25% | 27–35% | Muscle mass and grip strength matter more than fat percentage at this stage. |
The Other Direction: What Happens When Body Fat Is Too Low
Most health content focuses on excess body fat. But dropping below essential fat levels causes serious and rapidly escalating health problems — and it is worth covering clearly because fitness culture sometimes glorifies dangerously low body fat levels.
Essential fat is the minimum required for organ function, nerve tissue health, bone marrow, and hormonal production. Below these levels, the body begins cannibalizing itself. For men, essential fat is approximately 2–5%. For women, it is approximately 10–13%. Below the essential fat threshold, the following can occur:
- Hormonal disruption: Testosterone drops in men. In women, estrogen drops, causing amenorrhea (loss of menstrual cycle), bone density loss, and infertility.
- Immune suppression: Fat tissue plays a role in immune signalling. Severe depletion impairs immune function.
- Cardiac risk: Extremely low body fat has been associated with cardiac arrhythmias and electrolyte imbalances in extreme cases.
- Cognitive effects: The brain is approximately 60% fat by dry weight. Severe fat depletion affects cognitive function.
- Loss of protective fat padding: Organs and joints lose their cushioning, increasing injury risk.
The "shredded" physiques seen in bodybuilding competitions typically represent body fat percentages of 4–6% for men and 10–12% for women — levels that are achieved for brief periods through extreme methods and are not meant to be maintained. Many competitive bodybuilders report significant health consequences of spending extended time at these levels.
If you are concerned about body fat that may be too low — particularly if you are experiencing irregular menstrual cycles, fatigue, frequent illness, or stress fractures — speak with a physician. This is not a goal-oriented zone; it is a clinical risk zone.
How to Move Your Body Fat Percentage in the Right Direction
There is no single intervention that reduces body fat in isolation. The most effective approaches combine targeted nutrition, resistance training, and cardiovascular conditioning — not as separate programs but as an integrated strategy. Here is what the evidence supports most strongly.
1. Resistance Training Is Non-Negotiable
The single most effective long-term intervention for improving body composition is resistance training — not cardio, not crash dieting. Skeletal muscle is metabolically expensive tissue. Every pound of muscle you add increases your resting metabolic rate, burns more calories at baseline, and directly reduces your body fat percentage even before diet changes. ACSM evidence-based guidelines recommend 2–3 compound resistance training sessions per week for adults at all ages, with increasing importance after age 40.
2. Protein Intake Above the RDA
The standard recommended daily allowance of 0.8g of protein per kilogram of body weight is a survival minimum, not an optimization target. For body composition improvement and muscle preservation, the evidence consistently supports 1.6–2.2g per kilogram of body weight. Higher protein intake supports muscle protein synthesis, reduces muscle loss during caloric deficits, and increases the thermic effect of food — meaning you burn more calories digesting it than you do with carbohydrates or fat.
3. A Moderate, Sustained Caloric Deficit
Fat loss requires a caloric deficit — there is no mechanism by which the body reduces fat stores without energy expenditure exceeding intake over time. But the size of that deficit matters. Aggressive deficits (more than 500–750 calories below maintenance) disproportionately cause muscle loss alongside fat loss, worsening your body composition ratio. A moderate deficit of 300–500 calories per day, combined with adequate protein and resistance training, maximizes fat loss while preserving lean mass.
4. Sleep and Stress Management
This is the part most fitness content underemphasizes. A study in the Annals of Internal Medicine found that sleep-restricted individuals on a caloric deficit lost 55% less fat and 60% more lean mass than those who slept adequately — with identical caloric intake. Chronic sleep deprivation elevates cortisol, which promotes fat storage (particularly visceral fat) and inhibits muscle protein synthesis. You cannot out-train or out-diet chronic poor sleep.
5. Tracking: Frequency and Method
Measure body fat percentage every 3–4 months using the same method and conditions each time. In your 20s and 30s, quarterly is ideal if actively working toward a goal. In your 40s and 50s, every 2–3 months is recommended — this is when small drifts in body composition compound fastest if not caught early. In your 60s and beyond, tracking muscle mass and grip strength alongside body fat becomes more important than body fat alone.
If you want to understand how changes in body composition interact with your overall financial and health picture — particularly calorie needs, health risks, and related calculators — check out our BMI calculator and our Body Fat Calculator for quick reference numbers, or our Calorie Calculator to estimate your daily energy needs based on your body composition goals. For a complete view of your health metrics in one place, the medication dose calculation guide also covers how body weight and composition affect clinical dosing — relevant reading for anyone managing medications alongside a body composition program.
Sources and Further Reading
The body fat percentage ranges and clinical data in this article are drawn from the following peer-reviewed and institutional sources:
- Gallagher et al. (NIH/WHO): Age- and sex-stratified body fat percentage classifications, the most widely cited clinical reference for population-level benchmarks. View the classification table →
- American Council on Exercise (ACE): Five-category body fat classification framework (essential, athlete, fitness, acceptable, obese) with separate ranges for men and women.
- Harvard Health Publishing: Clinical guidance on healthy body fat percentages by age, sarcopenic obesity, and measurement methods.
- BodySpec (2025): Analysis of over 450,000 DEXA scans providing real-world population body fat distribution data by age and sex — one of the largest real-world body composition datasets available.
- Annals of Family Medicine (2025): Study confirming body fat percentage as a stronger predictor of 15-year mortality risk than BMI in adults aged 20–49.
- Frontiers in Public Health (June 2025): Large-scale study (n=29,064) constructing age-specific body fat percentage percentile curves for adults aged 20–79 using GAMLSS methodology.